Follow risks evolution
Following the risks evolution in a cluster or in an application is one of the main Kubees purposes.
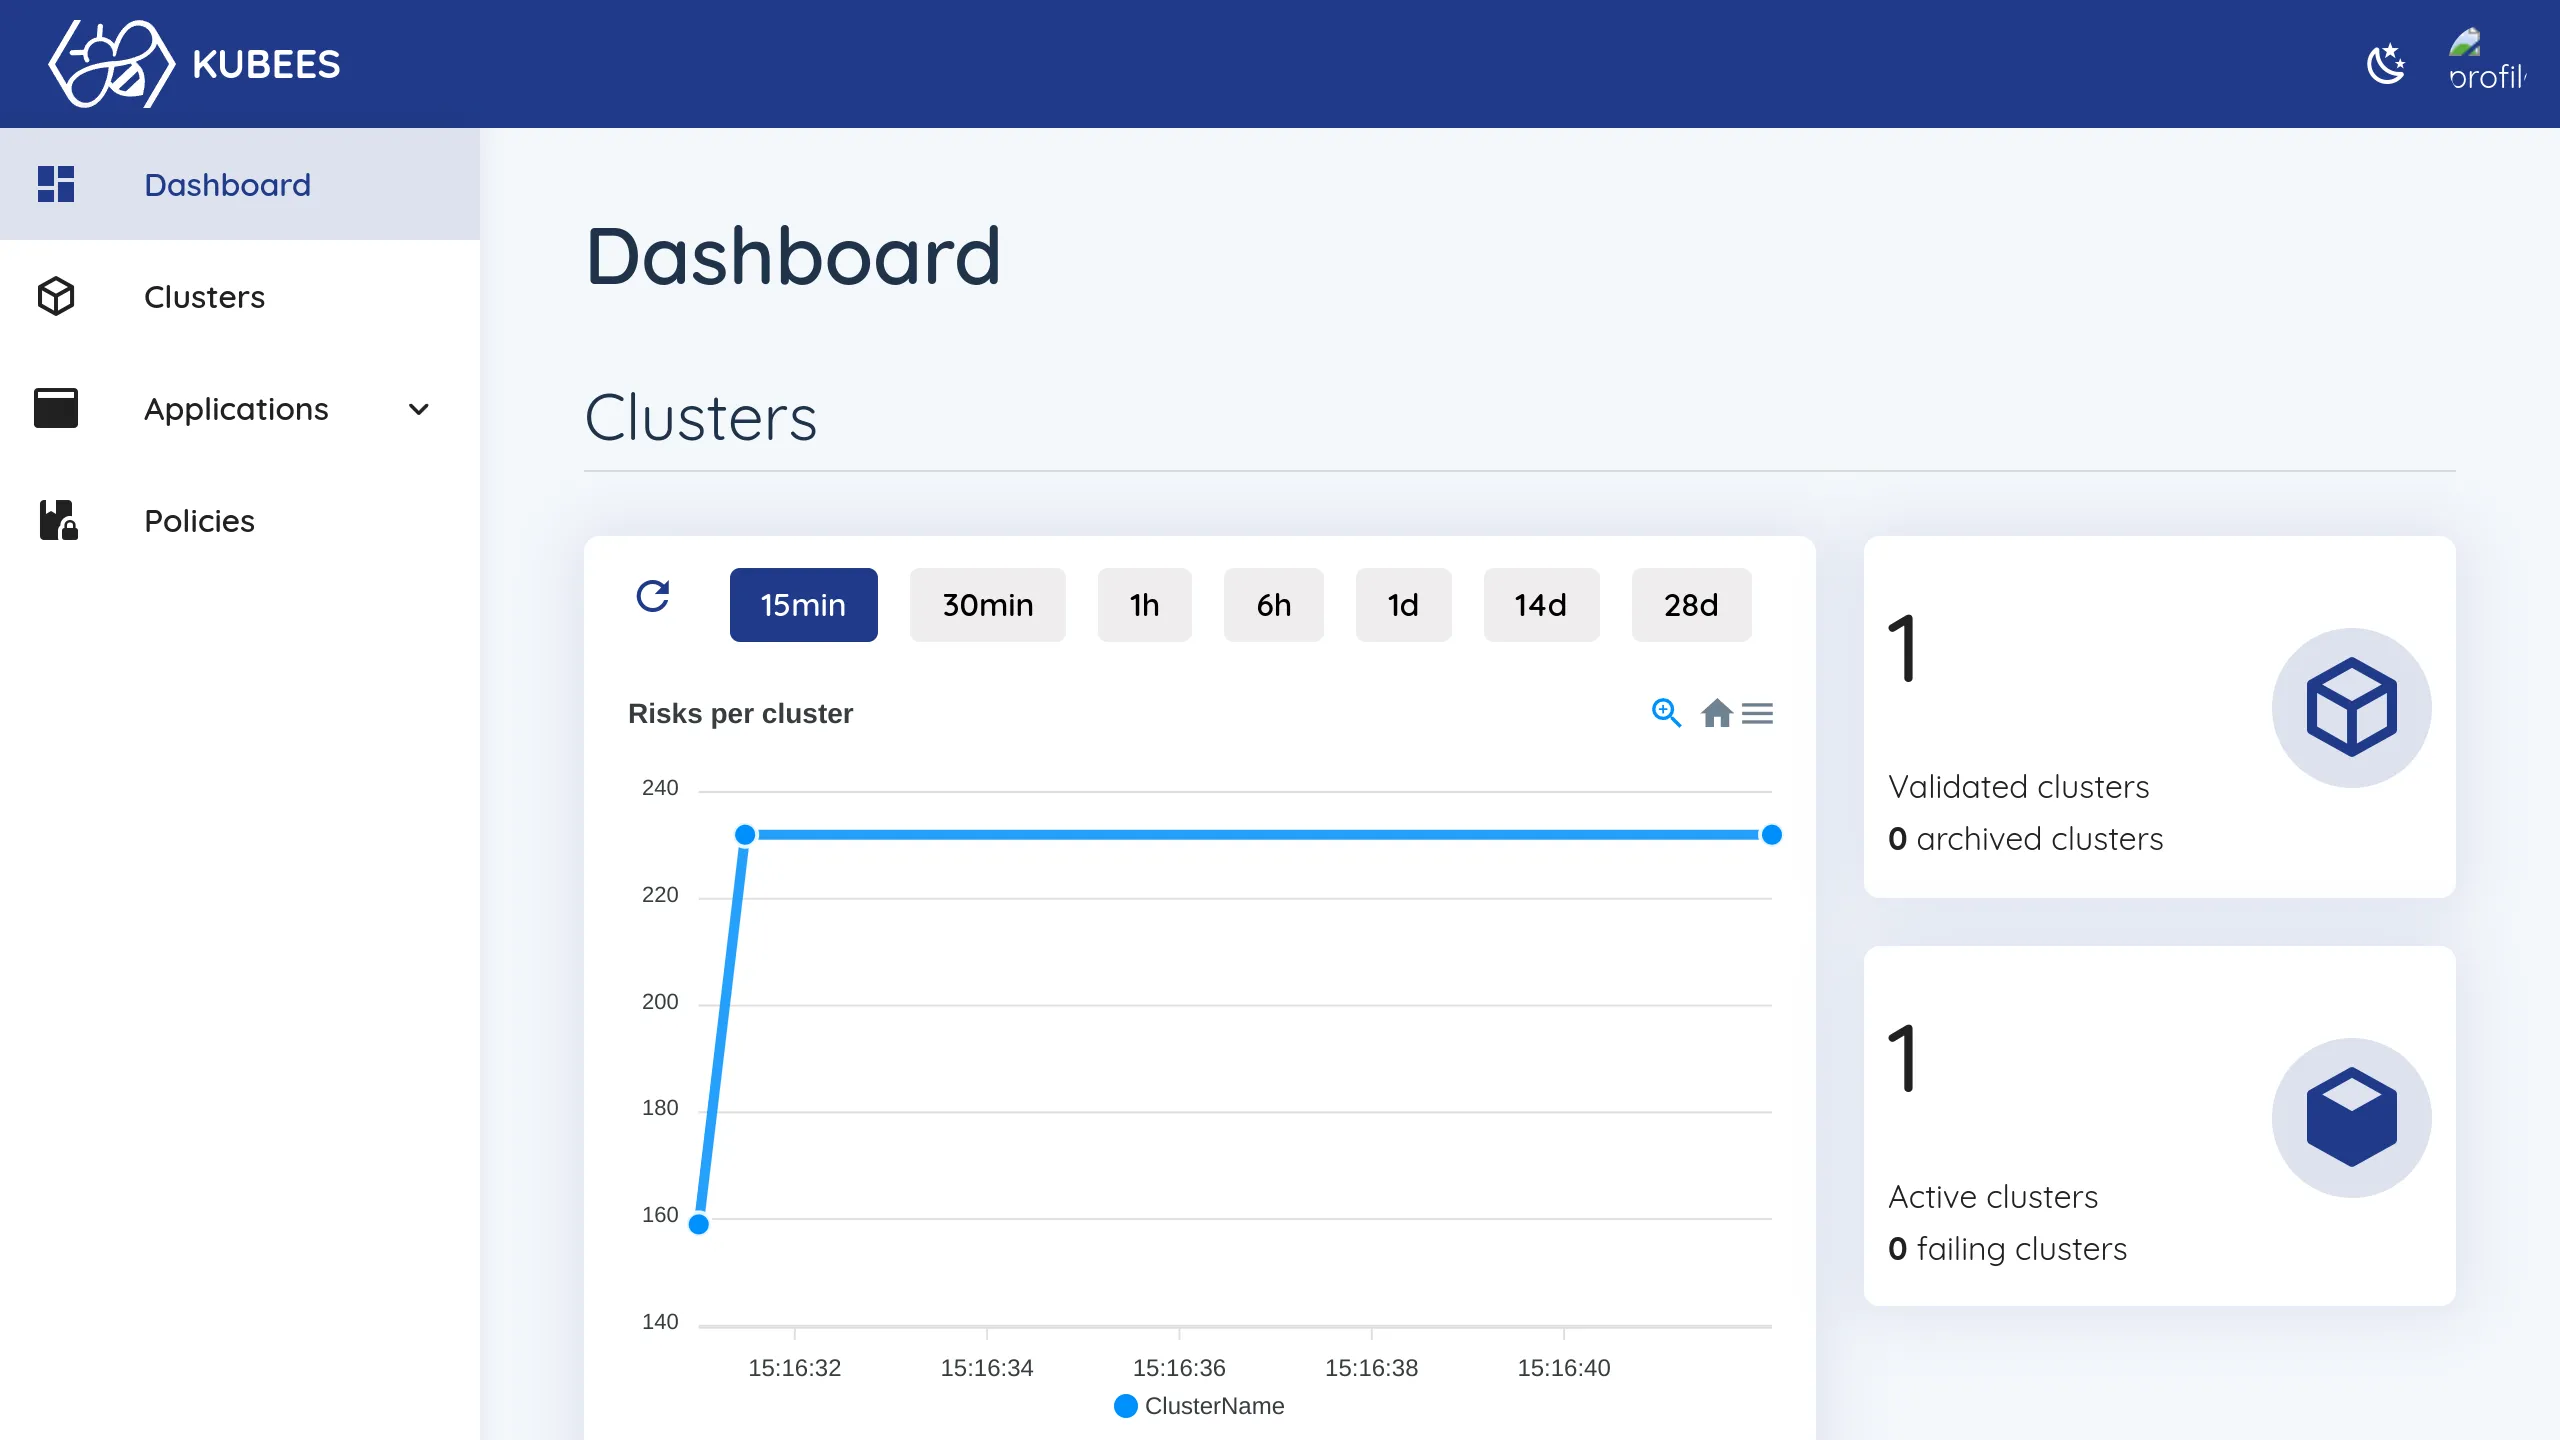
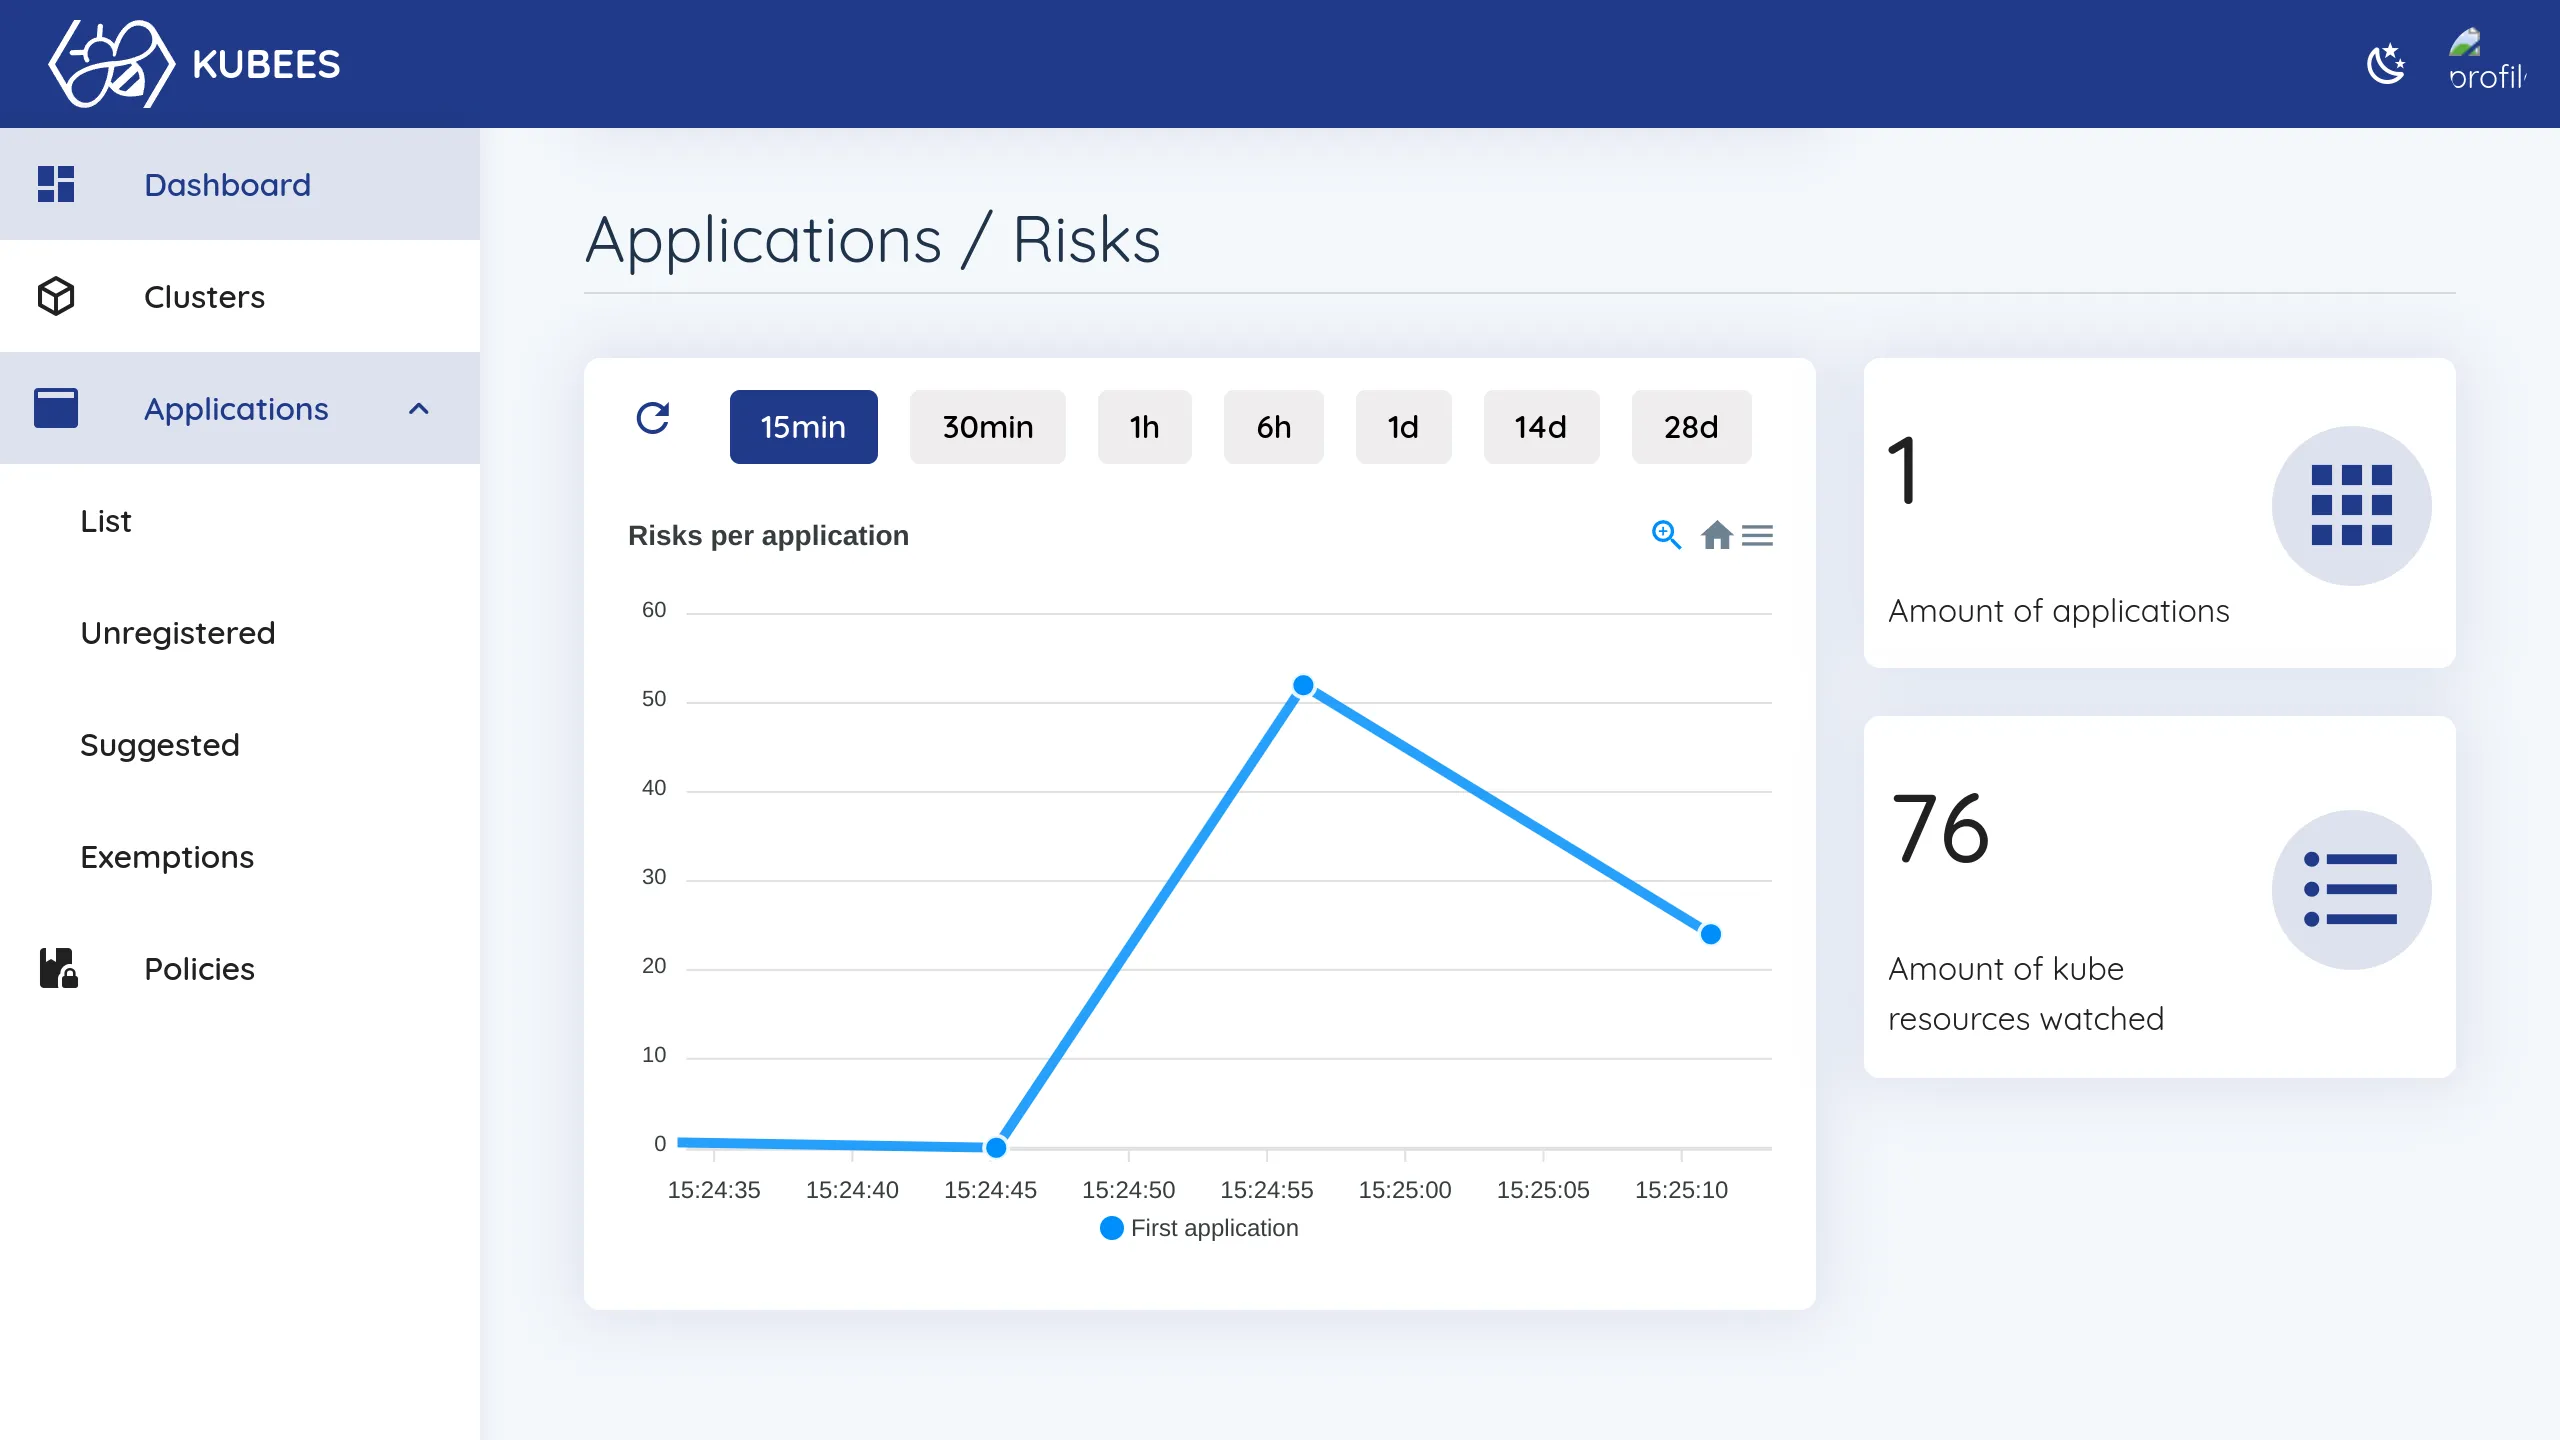
First of all, you can get an overview of all the collected statistics on the main dashboard. Those statistics mainly show the risk evolution on each cluster and on each application. It also shows the amount of rules, how much are valid or firing and if you ignored some of them, as explained in the rule disabling guide.
Cluster specific risks
To get more precise about the statistics, you can check cluster-specific statistics. To to this, navigate to the clusters list page clicking “Clusters” in the side menu. Once on the cluster list, you can access the cluster statistics clicking on the wanted cluster card.
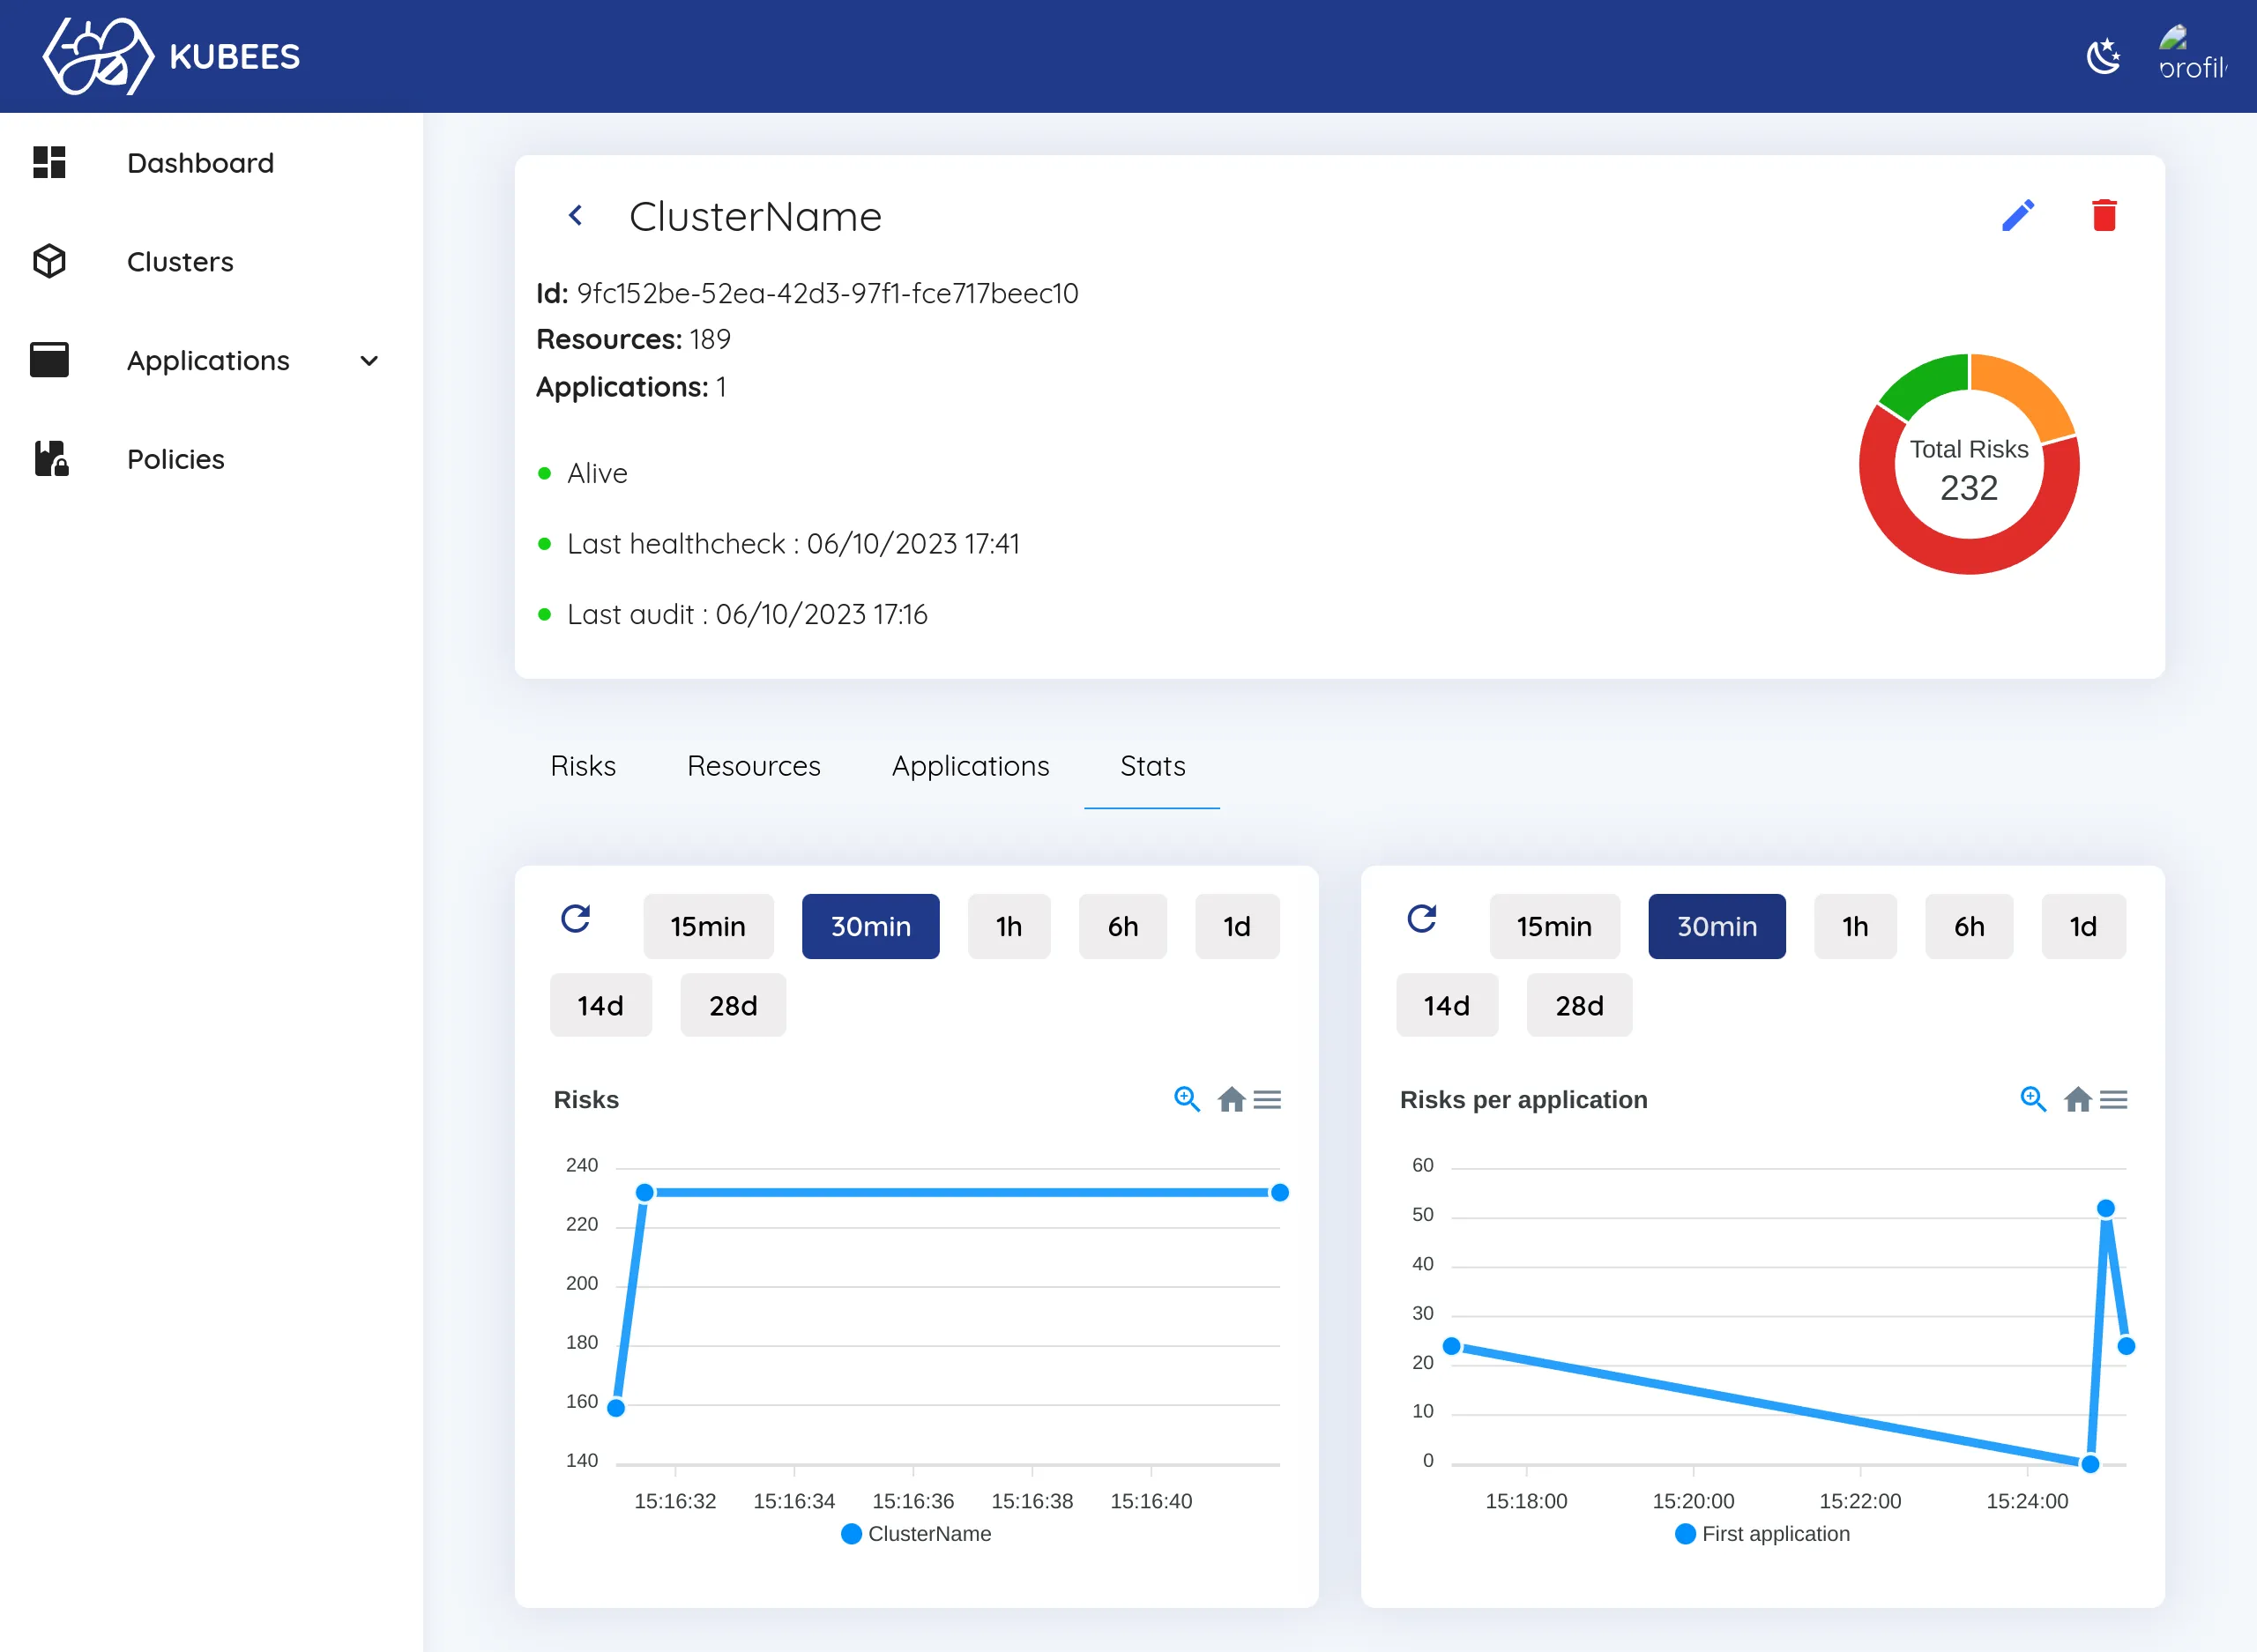
This page allows to know the most important informations related to the cluster analysis. In particular :
- The amount of resources in this specific cluster
- The amount of applications related to this cluster
- The cluster status
- Last healthcheck date
- Last audit date
You also have access to two charts. The first one shows the evolution of the identified risks overtime. The second one shows this cluster related applications risks evolution.
Application specific risks
You can have access to a specific application risks evolution. To achieve this, navigate to the application list directly in the side menu to find all the applications, or in the “Application” tab of a cluster, like in the previous screenshot, which allows you to get the application related to the selected cluster.
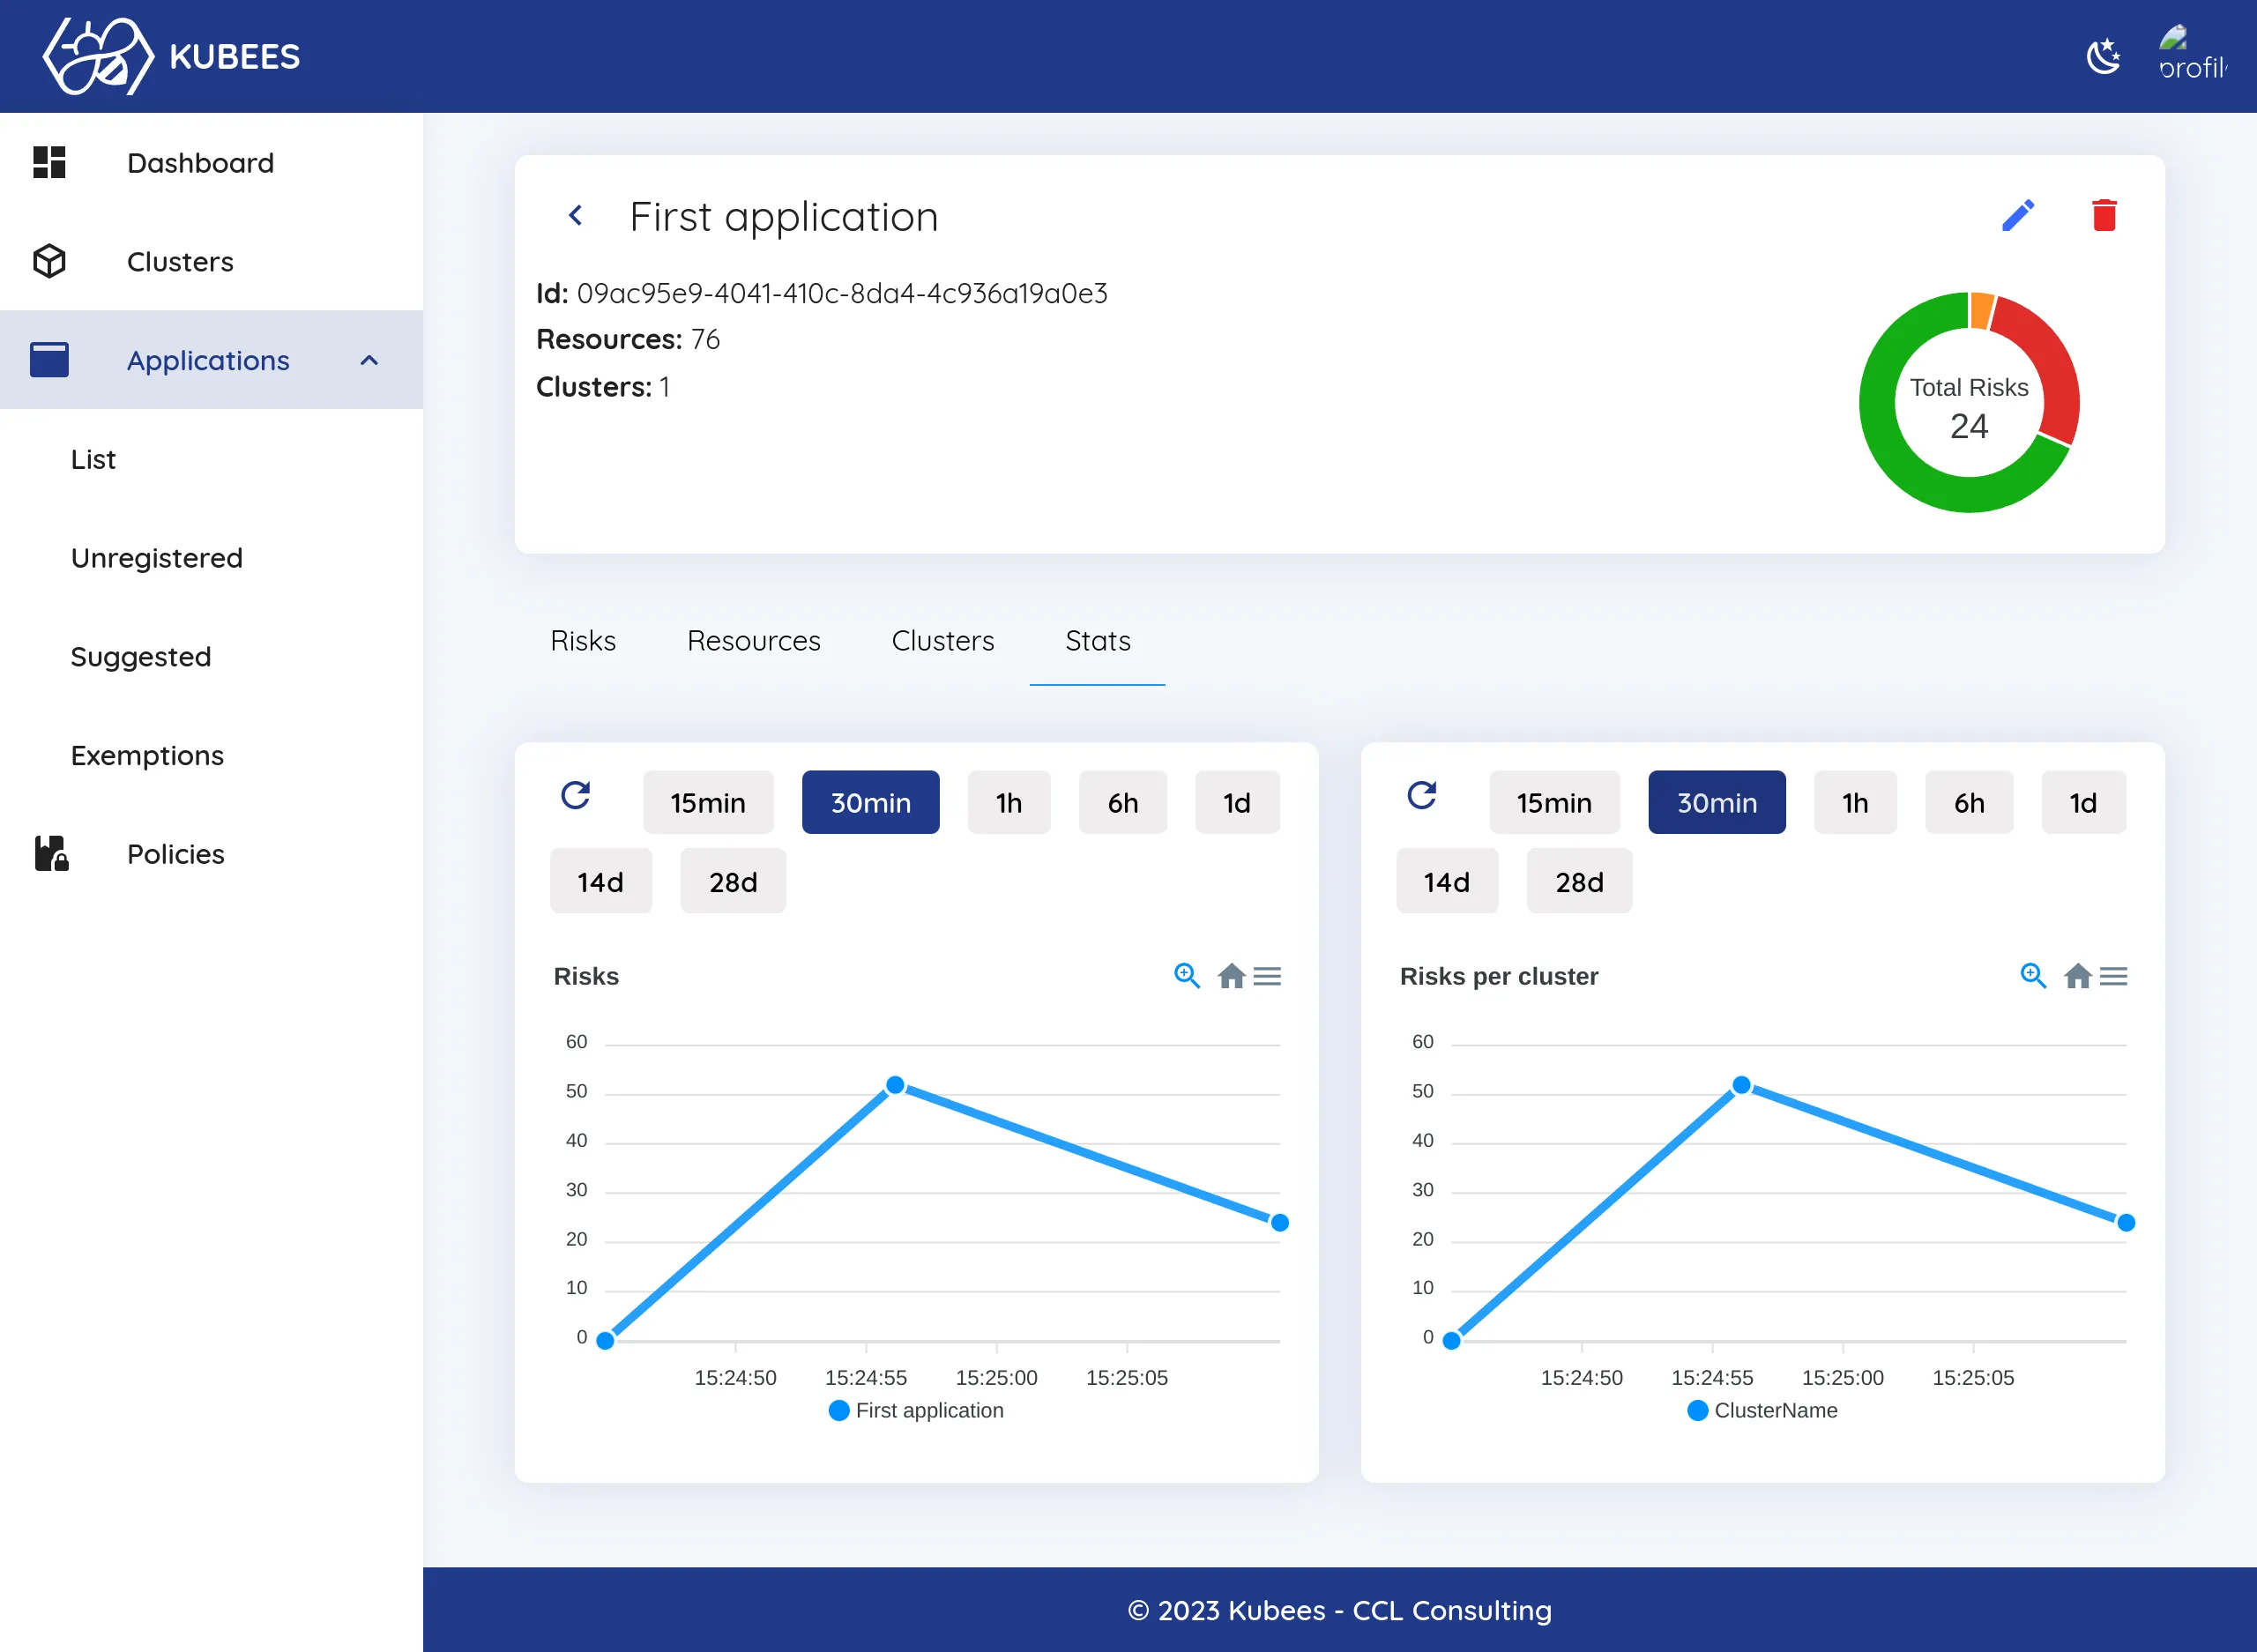
The informations are basically shown the same way as the cluster statistics. But the first chart shows the risks evolution of the selected application, and the second chart is now showing the application risks in each cluster where it’s present.